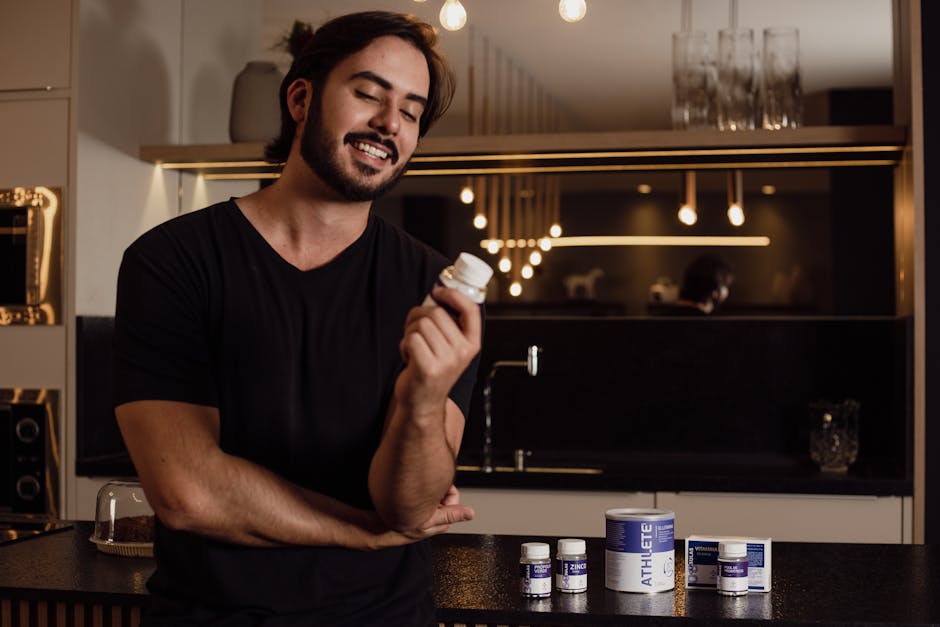
Sports Nutrition Pricing Strategy for United States: What the Market Will Bear in 2026
For sports nutrition brands planning global expansion, the United States remains the single most important prize market—but also one of the most unforgiving on price architecture, regulatory compliance, and channel execution. In 2026, success in Sports Nutrition is not just about having a strong formula. It depends on whether your price point fits US consumer expectations across ecommerce, specialty retail, and online sales, while still leaving room for marketplace fees, promotions, and distributor margins.
The US market will reward credible brands with clear positioning, clinically relevant ingredients, and disciplined pricing. It will punish brands that enter with commodity products, unsubstantiated claims, or a margin model that collapses under Amazon fees and trade spend. Below is a practical guide to what the market will bear, where demand is concentrated, and how to build a pricing strategy that supports durable market entry.
Market Overview
The US sports nutrition market in 2026 is large, mature, and still growing faster than many adjacent wellness categories. Demand is being supported by mainstream exercise participation, higher protein intake across age groups, and the normalization of powders, ready-to-drink products, gummies, and performance hydration among everyday consumers—not just bodybuilders or elite athletes.
For pricing strategy, the most important dynamic is channel mix. Online sales continue to account for a major share of category growth, but physical retail still matters for trial, trust, and scale. Amazon is the dominant digital discovery and conversion engine for many subcategories, making amazon ranking, review velocity, and pricing parity critical commercial levers.
| US Sports Nutrition Market Metric | 2024 | 2025 | 2026e |
|---|---|---|---|
| Total market value | $24.8B | $26.2B | $27.9B |
| Annual growth rate | 8.1% | 5.6% | 6.5% |
| Online share of sales | 37% | 39% | 41% |
| Brick-and-mortar share | 63% | 61% | 59% |
| Amazon share of online sports nutrition | 46% | 47% | 48% |
The overall growth rate is not uniform across channels. Club stores, grocery, and mass retail are driving broad household penetration of protein powders and RTD shakes, while Amazon and DTC are supporting premiumization, trial packs, and fast-moving niche ingredients such as creatine gummies and hydration stick packs.
| Major US Sales Channels | 2026 Share | Typical Role in Launch | Pricing Pressure |
|---|---|---|---|
| Amazon | 19.5% of total market | Discovery, review building, national reach | High |
| Specialty retail | 15% | Performance credibility, expert-assisted selling | Medium |
| Mass retail | 14% | Volume, mainstream penetration | High |
| Grocery and natural | 11% | Everyday wellness, RTD and bars | Medium |
| DTC websites | 9% | Higher margin, bundles, subscriptions | Low to medium |
| Clubs, gyms, practitioners, other | 31.5% | Sampling, impulse, community distribution | Variable |
For a new entrant, the implication is clear: the US is not a market where one list price works everywhere. You need channel-specific pricing guardrails, MAP policies where appropriate, and a margin model that reflects retailer markup, Amazon referral and fulfillment fees, promotional cadence, and returns.
Opportunity Analysis
The strongest opportunities in 2026 sit at the intersection of performance credibility and mainstream usability. The best categories are not necessarily the cheapest to launch, but they are the ones where consumers will still pay a premium if the value proposition is obvious and the product format is convenient.
Best-performing categories
- Protein powder: Still the largest segment, especially whey isolate, clear whey, and premium plant blends. Mainstream acceptable price bands are typically $1.40–$2.20 per serving, with premium clinical or grass-fed offerings pushing above $2.30.
- Ready-to-drink protein: Strong in club, convenience, and grocery. Consumers tolerate higher unit pricing when taste and macros are strong. Typical retail range: $3.00–$4.50 per bottle, with multi-pack economics critical online.
- Creatine: One of the most resilient growth pockets. Plain creatine monohydrate remains price sensitive, but flavored formats, capsules, and gummies can command meaningful premiums if dosage is transparent.
- Hydration/electrolytes: Fast growth among active lifestyle users. Stick packs and tubs are both working, with “clean hydration” and low-sugar claims performing well.
- Pre-workout: A crowded but still profitable category when positioned around energy, focus, pump, or stimulant-free performance.
Fastest-growing ingredients and formats
Across Amazon best sellers lists, specialty retail resets, and social-driven product launches, several trends stand out in 2026:
- Creatine monohydrate: Still benefiting from broad consumer awareness and strong science recognition.
- Electrolyte blends: Sodium-forward hydration, often with magnesium and potassium, continues to grow among both athletes and general wellness users.
- Protein innovation: Clear protein, higher-leucine blends, and digestion-positioned proteins are gaining traction.
- Gummies and stick packs: Higher COGS, but excellent convenience and giftability. Consumers often accept a 20–40% premium over standard powders if dosage and flavor are compelling.
- “No crash” or stimulant-free formats: Particularly relevant in pre-workout and focus-support products.
Pricing benchmarks by subcategory
| Subcategory | Typical US Price Range | Common Consumer Benchmark | Notes |
|---|---|---|---|
| Whey protein powder, 25–30 servings | $34.99–$59.99 | $1.50–$2.00 per serving | Premium if isolate, grass-fed, or digestive support added |
| Plant protein, 20–25 servings | $29.99–$49.99 | $1.60–$2.20 per serving | Taste remains a key premium/discount driver |
| Creatine monohydrate powder, 50–80 servings | $19.99–$34.99 | $0.30–$0.50 per serving | Highly price-transparent online |
| Pre-workout, 20–30 servings | $29.99–$54.99 | $1.30–$2.00 per serving | Flavor and effect claims influence premium ceiling |
| Electrolyte sticks, 20–30 servings | $19.99–$39.99 | $0.80–$1.50 per serving | Single-serve convenience supports premiumization |
Actionable takeaway: if your landed product cost forces you above the upper band of these ranges without a clear differentiation story, the US market will likely resist. This is where a structured market read matters. Many brands use a targeted intelligence product such as the US Market Snapshot ($499) to validate realistic price bands before committing to packaging and MOQ decisions.
Distribution Landscape
The US distribution landscape for sports nutrition is fragmented but navigable if you align your product with the right channel economics.
Top retailers and chains
- Amazon: The most important online marketplace for velocity, reviews, and competitive visibility.
- Walmart: Critical for mass volume and increasingly relevant online.
- Target: Strong for lifestyle-oriented, design-forward, and better-for-you positioning.
- Costco and Sam’s Club: Powerful for protein and RTD multipacks, but margin and pack-format requirements are demanding.
- GNC: Still relevant for specialty sports nutrition and performance education.
- The Vitamin Shoppe: Important for specialty exposure and omnichannel shoppers.
- Whole Foods Market and Sprouts: Good fit for cleaner-label or natural-positioned products.
- CVS and Walgreens: Selective opportunity for RTD, bars, and mainstream supplements.
Amazon and ecommerce opportunity
For many new brands, Amazon USA is the fastest route to proof of demand, but it is also the harshest pricing environment. The practical issue is not just your list price. It is your net contribution after referral fees, FBA charges, coupons, ad spend, and returns. In many subcategories, first-page amazon ranking requires sustained ad support and review accumulation. That means a product priced too low can win clicks but lose money.
As a rule of thumb, many successful brands target a gross margin structure that leaves room for 25–35% total marketplace selling costs during launch. If your MSRP cannot absorb that, a DTC-first or specialty-retail-first path may be more rational. Brands already preparing for Amazon often benefit from an Amazon Listing Audit to identify title, image, compliance, and conversion gaps before spend is committed.
DTC potential
DTC remains attractive for premium sports nutrition because it supports:
- Subscription pricing for repeat-use categories such as protein and hydration
- Bundle economics that increase AOV
- Educational landing pages for more technical products
- Email/SMS retention programs that reduce customer acquisition payback periods
In practice, DTC works best when the product has either a strong community story, a regimen-based use case, or a sufficiently high AOV to absorb paid acquisition. A single low-ticket SKU without bundling is usually harder to scale profitably.
Distributors and wholesalers
Depending on channel, brands may work with broadline or specialty partners such as UNFI, KeHE, Europa Sports Partners, and regional supplement distributors serving gyms and independents. Each layer of distribution compresses pricing flexibility, so founders should model wholesale, distributor, and retail margins before setting MSRP—not after.
Regulatory Snapshot
In the United States, sports nutrition products are generally regulated as dietary supplements or conventional foods, depending on format and positioning. The main authorities are the FDA for product and labeling oversight and the FTC for advertising substantiation.
Core label requirements
- Statement of identity
- Net quantity of contents
- Supplement Facts or Nutrition Facts panel, as applicable
- Ingredient list in descending order by weight
- Name and place of business of manufacturer, packer, or distributor
- Major allergen disclosure when required
- Domestic contact information for serious adverse event reporting for supplements
Allowed and prohibited claims
Brands may generally use structure/function claims such as “supports muscle recovery” or “helps maintain hydration,” provided they are truthful, substantiated, and properly framed. They may not claim to diagnose, treat, cure, or prevent disease. Claims such as “treats dehydration,” “reverses muscle wasting,” or “prevents kidney disease” would create high risk.
Performance claims require discipline. If a pre-workout claims “clinically proven endurance support,” the brand should hold substantiation tied to the finished product or a very defensible evidence base for the ingredients at the disclosed dose.
Ingredient restrictions and risk areas
- Novel ingredients may trigger scrutiny around lawful marketing status.
- Stimulant-heavy products face heightened risk if claims, dosage, or safety framing are aggressive.
- Hidden drug, sexual enhancement, or pharmaceutical-adjacent contamination issues are a major enforcement concern in supplements generally.
- Sports products containing botanicals or exotic compounds should be reviewed carefully for FDA and retailer acceptability.
Certifications that matter
- cGMP compliance: Essential for supplement manufacturing credibility
- NSF Certified for Sport or Informed Sport: Particularly valuable for athlete-facing products
- Non-GMO, vegan, gluten-free: Useful where relevant, but should not replace efficacy positioning
- Third-party testing: Often expected by retailers and sophisticated consumers
Estimated compliance timeline and costs
| Compliance Task | Typical Cost Range | Estimated Timeline |
|---|---|---|
| US label review and claim check | $800–$2,500 per SKU | 1–2 weeks |
| Analytical testing / COA package | $1,000–$4,000 per SKU | 2–4 weeks |
| Artwork updates and regulatory revisions | $500–$2,000 | 1–3 weeks |
| Third-party certification audit | $5,000–$20,000+ | 6–16 weeks |
For brands entering from abroad or adapting existing packs, FDA-facing label remediation should happen early. An AI Label Compliance Analysis ($999) can help identify claim, format, and disclosure issues before inventory is printed or shipped. If the current packaging is in another language, Label Translation support can reduce rework risk.
Launch Difficulty Score
The US sports nutrition market offers exceptional upside, but the barrier is not low. Pricing pressure, sophisticated competition, and compliance expectations make this a medium-to-hard launch category.
| Factor | Score (0–100) | Interpretation |
|---|---|---|
| Demand | 88 | Large, resilient category with broad mainstream appeal |
| Competition | 32 | Highly crowded, especially on Amazon and core powder formats |
| Regulatory Ease | 58 | Manageable with proper review, but claims and ingredient status matter |
| Margin Opportunity | 71 | Attractive if differentiated and channel pricing is disciplined |
| Overall Launch Difficulty Score | 63 | Moderately difficult but commercially worthwhile |
Actionable Next Steps
- Benchmark your category by price-per-serving, not just MSRP. US buyers compare value quickly, especially online. Build your model against the top 20 Amazon and specialty retail competitors in your subcategory.
- Choose one hero SKU for market entry. A focused launch outperforms a broad assortment. Protein, creatine, hydration, or pre-workout can each work, but only if your positioning is sharp.
- Stress-test channel margins before launch. Model DTC, Amazon FBA, wholesale, and distributor scenarios separately. Include ad spend, couponing, and returns assumptions.
- Run a compliance review before artwork is finalized. Check Supplement Facts formatting, claims, allergens, and ingredient naming against FDA expectations and retailer standards.
- Build Amazon readiness early. Keyword strategy, A+ content, image hierarchy, and review generation planning all affect amazon ranking and launch efficiency.
- Sequence channels intentionally. Start where your economics and differentiation are strongest—often Amazon plus DTC, or specialty plus DTC—then expand into broader retail once repeatability is proven.
- Use a market-entry intelligence package before committing budget. A full US Launch Report ($999) can help validate pricing, channel fit, competition, and compliance risk before production and trade spend escalate.
Sources
Primary and supporting sources used for market sizing, channel direction, and regulatory interpretation include:
- U.S. Food and Drug Administration (FDA) — dietary supplement labeling, cGMP, and compliance guidance
- Federal Trade Commission (FTC) — health advertising and substantiation standards
- Council for Responsible Nutrition (CRN) — US supplement consumer survey findings and category usage data
- Nutrition Business Journal — sports nutrition market and channel trend reporting
- SPINS and Circana — retail and natural channel sales tracking referenced in industry reporting
- Amazon.com US marketplace — observed category pricing, pack architecture, and best sellers benchmarks across sports nutrition subcategories in 2026
- GNC, The Vitamin Shoppe, Walmart, Target, Costco, Sam’s Club, Whole Foods Market, and Sprouts — public assortment and pricing observations for the US market
- NSF and Informed Sport — certification program information relevant to sports nutrition products sold in the United States
For founders and marketing directors, the key lesson is simple: the United States rewards sports nutrition brands that price with discipline, respect regulatory compliance, and tailor channel strategy for ecommerce, retail, and repeat online sales. If you want a sharper view of what the market will bear for your specific SKU, positioning, and channel plan, request a personalized US Launch Intelligence Report or get a free Brand Readiness Score from US Brand Launch.